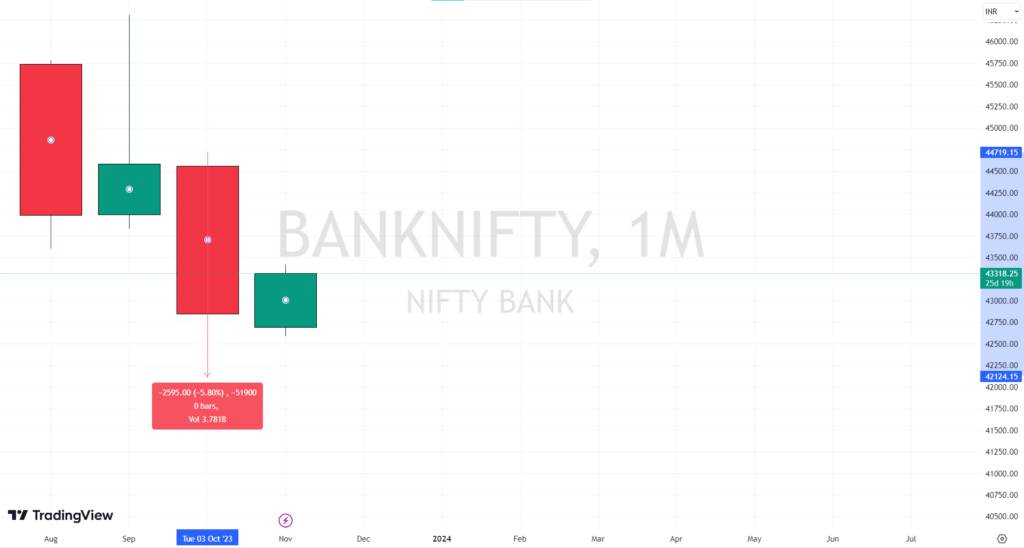
BANK NIFTY index is represent the banking sector where both private and public banks include. Last month the banks are down by 5% to 6% by which the bank nifty are down by 5.78% which was almost 2584 points. In October month BANK NIFTY high was 44710.55 , low- 42105.40, close- 42845.95, open-44561.50.
MONTHLY ANALYSIS OF BANK NIFTY
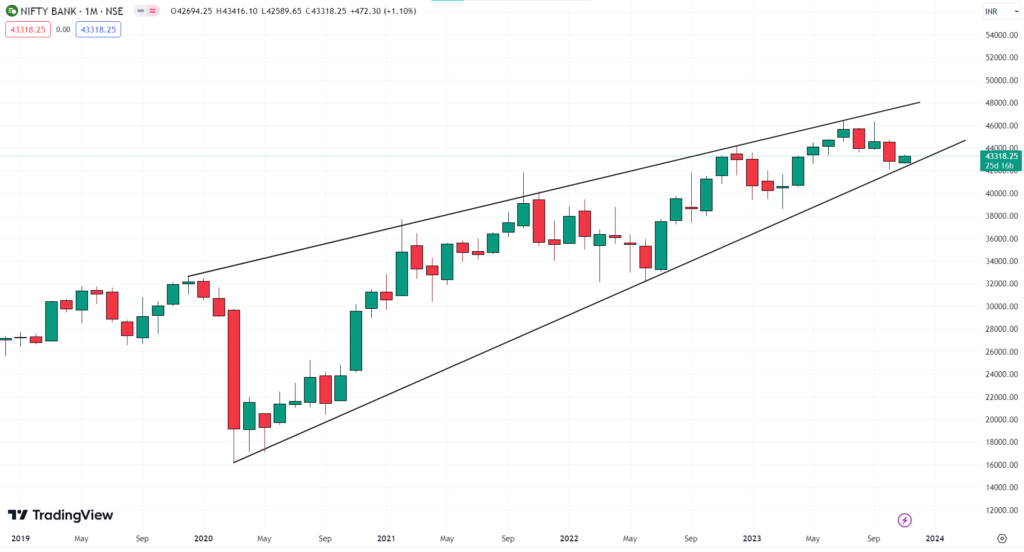
Analyzing the chart in different time frame is an important part of the trading . Especially, when the overall sentiment of the market is showing indication of down fall. We have to analyze the chart in every time frame to be sure about the down fall because the price action indicate before the market react on the news. In monthly time frame of BANK NIFTY price form a ascending wedge pattern and currently price is traded near to a support trendline of the ascending wedge pattern.
WEEKLY TIME FRAME OF BANKNIFTY
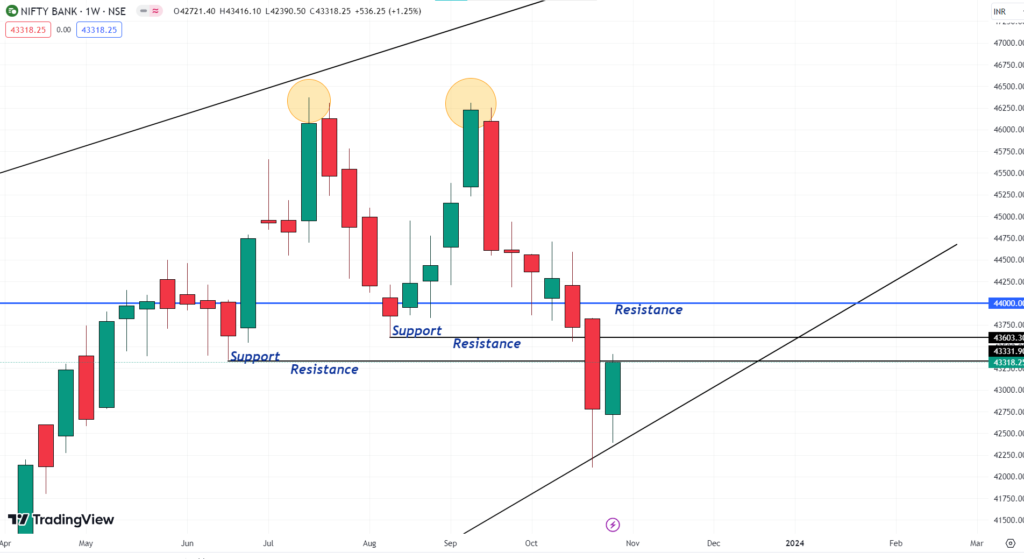
In weekly time frame price form a double top formation on 17 JULY 2023 and 11 SEPTEMBER 2023 and the double top formation low which was form on 14 AUGUST 2023 was break on 23 OCTOBER 2023. So, now the previous level which act as a support now act as a resistance.
DAILY TIMEFRAME OF BANKNIFTY
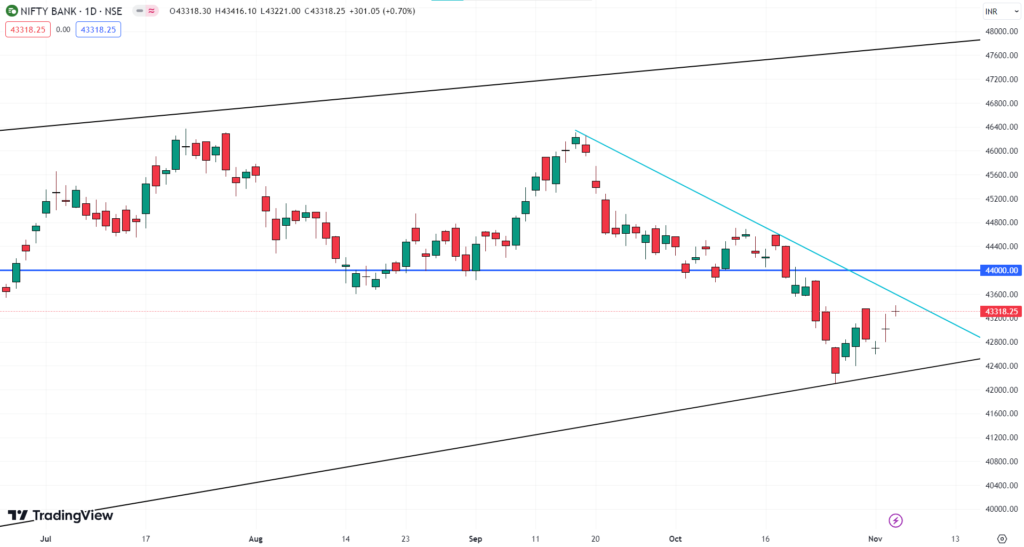
In daily timeframe price form a resistance trendline from 15 September 2023 and constantly reversing from it and currently price was traded near to the same resistance trend line and from past three days price done a gap opening and form doji candle on daily timeframe, which show a tough fight between buyers and sellers by which it was quiet difficult to predict the next move of the market.
After analyzing every timeframe my view was on the buy side because on monthly timeframe price action show bullishness in the market.
