The weighted average of the 50 biggest Indian firms listed on the National Stock Exchange is represented as the benchmark NIFTY 50 index for the Indian stock market.
Owned entirely by the NSE Strategic Investment Corporation Limited, NSE Indices (formerly India Index Services & Products Limited) is responsible for the ownership and management of the Nifty 50. Up until 2013, NSE Indices and Standard & Poor’s had a marketing and licencing arrangement for co-branding equity indices. One of Nifty’s numerous stock indices, the Nifty 50 index was introduced on April 22, 1996.
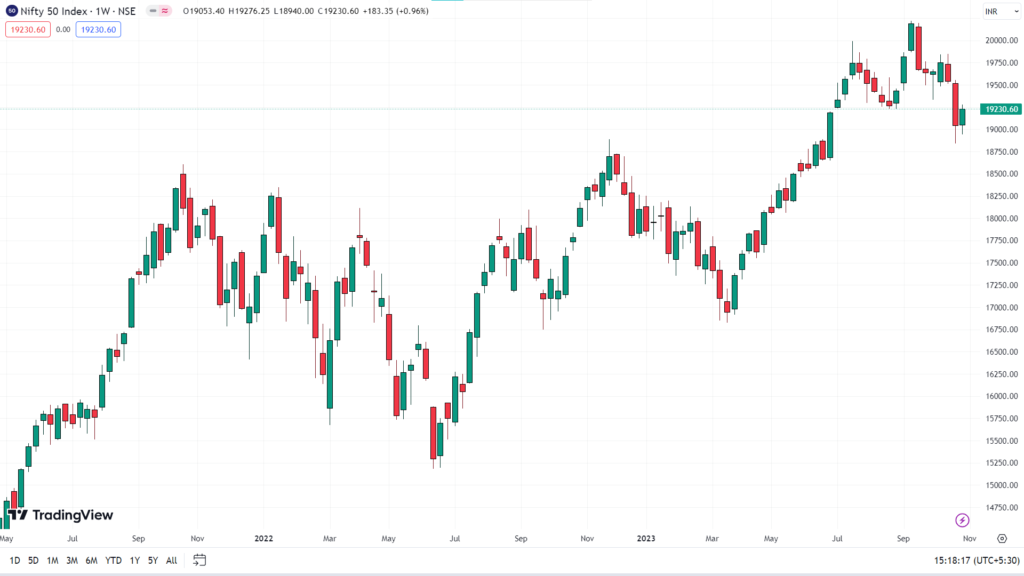
MONTHLY TIME FRAME OF NIFTY 50
In monthly time frame we can see a bull rally from 1 APRIL 2020 to 1 OCTOBER 2021 and then price move in a sideways from 1 OCTOBER 2021 to 2 MAY 2023 but then we realize that price is forming a flag and pole pattern on monthly time frame. So, we mark the high from 1 OCTOBER 2021 to 1 DECEMBER 2022 and extend it then mark a low of the from by a trendline from 1 JUNE 2022 TO 1 MARCH 2023 and extend it. Then on 1 June 2023 price done a break out of the level on upside and currently it looks like price a doing retest of the levels on monthly timeframe.
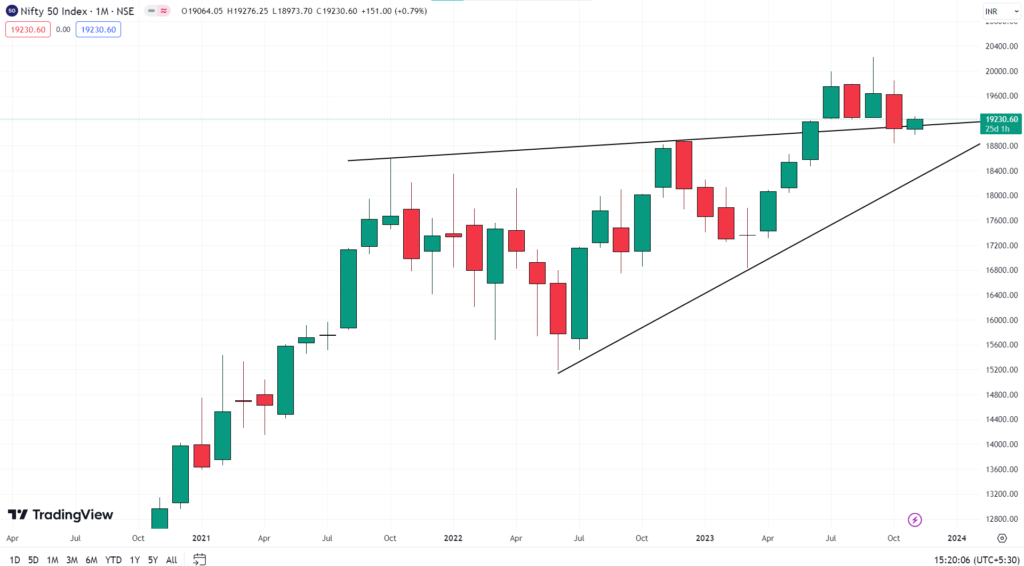
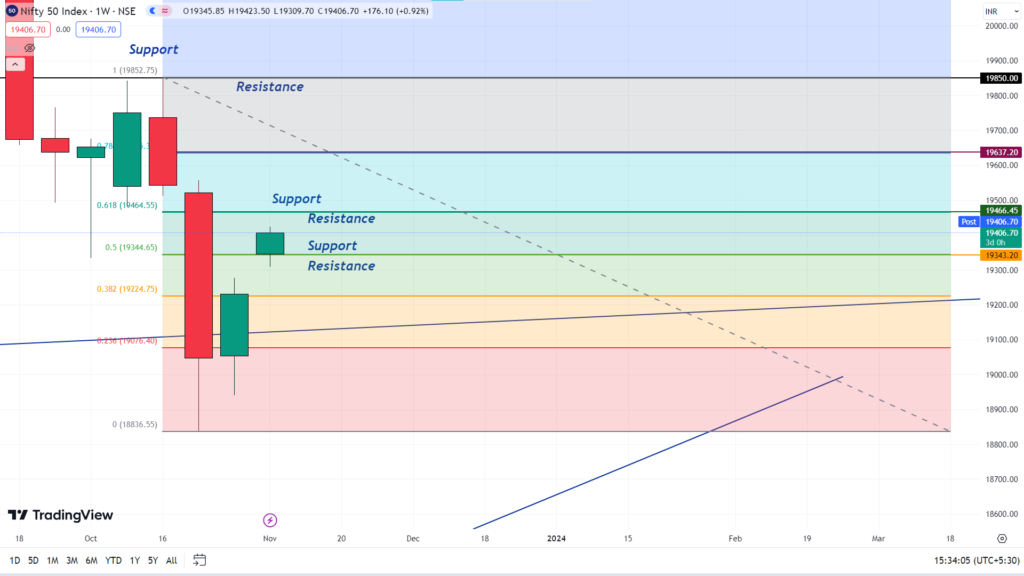
WEEKLY TIME FRAME OF NIFTY 50
In weekly time frame price has fall from 19850 to 18850 and taken support from our monthly timeframe mark level and take support from it then start breaking it’s resistance level and currently if we mark the high and low of the rally by fib-retracement we have 2 levels in which 0.5 level was broken and currently price is moving towards 0.618 levels and probably have a chances to break it
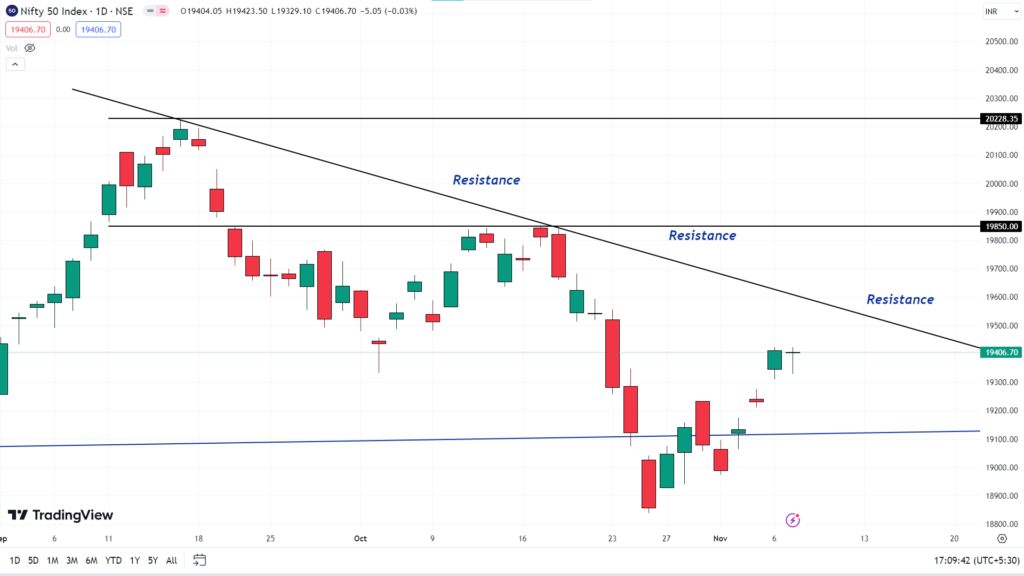
DAILY TIME FRAME OF NIFTY 50
In daily time frame price is constantly making lower low formation by which we see a trendline resistance and currently price is moving towards that trendline resistance. There is possibility that price could face resistance from 19600 level and then break it and could go near to the all time high of nifty 50.
