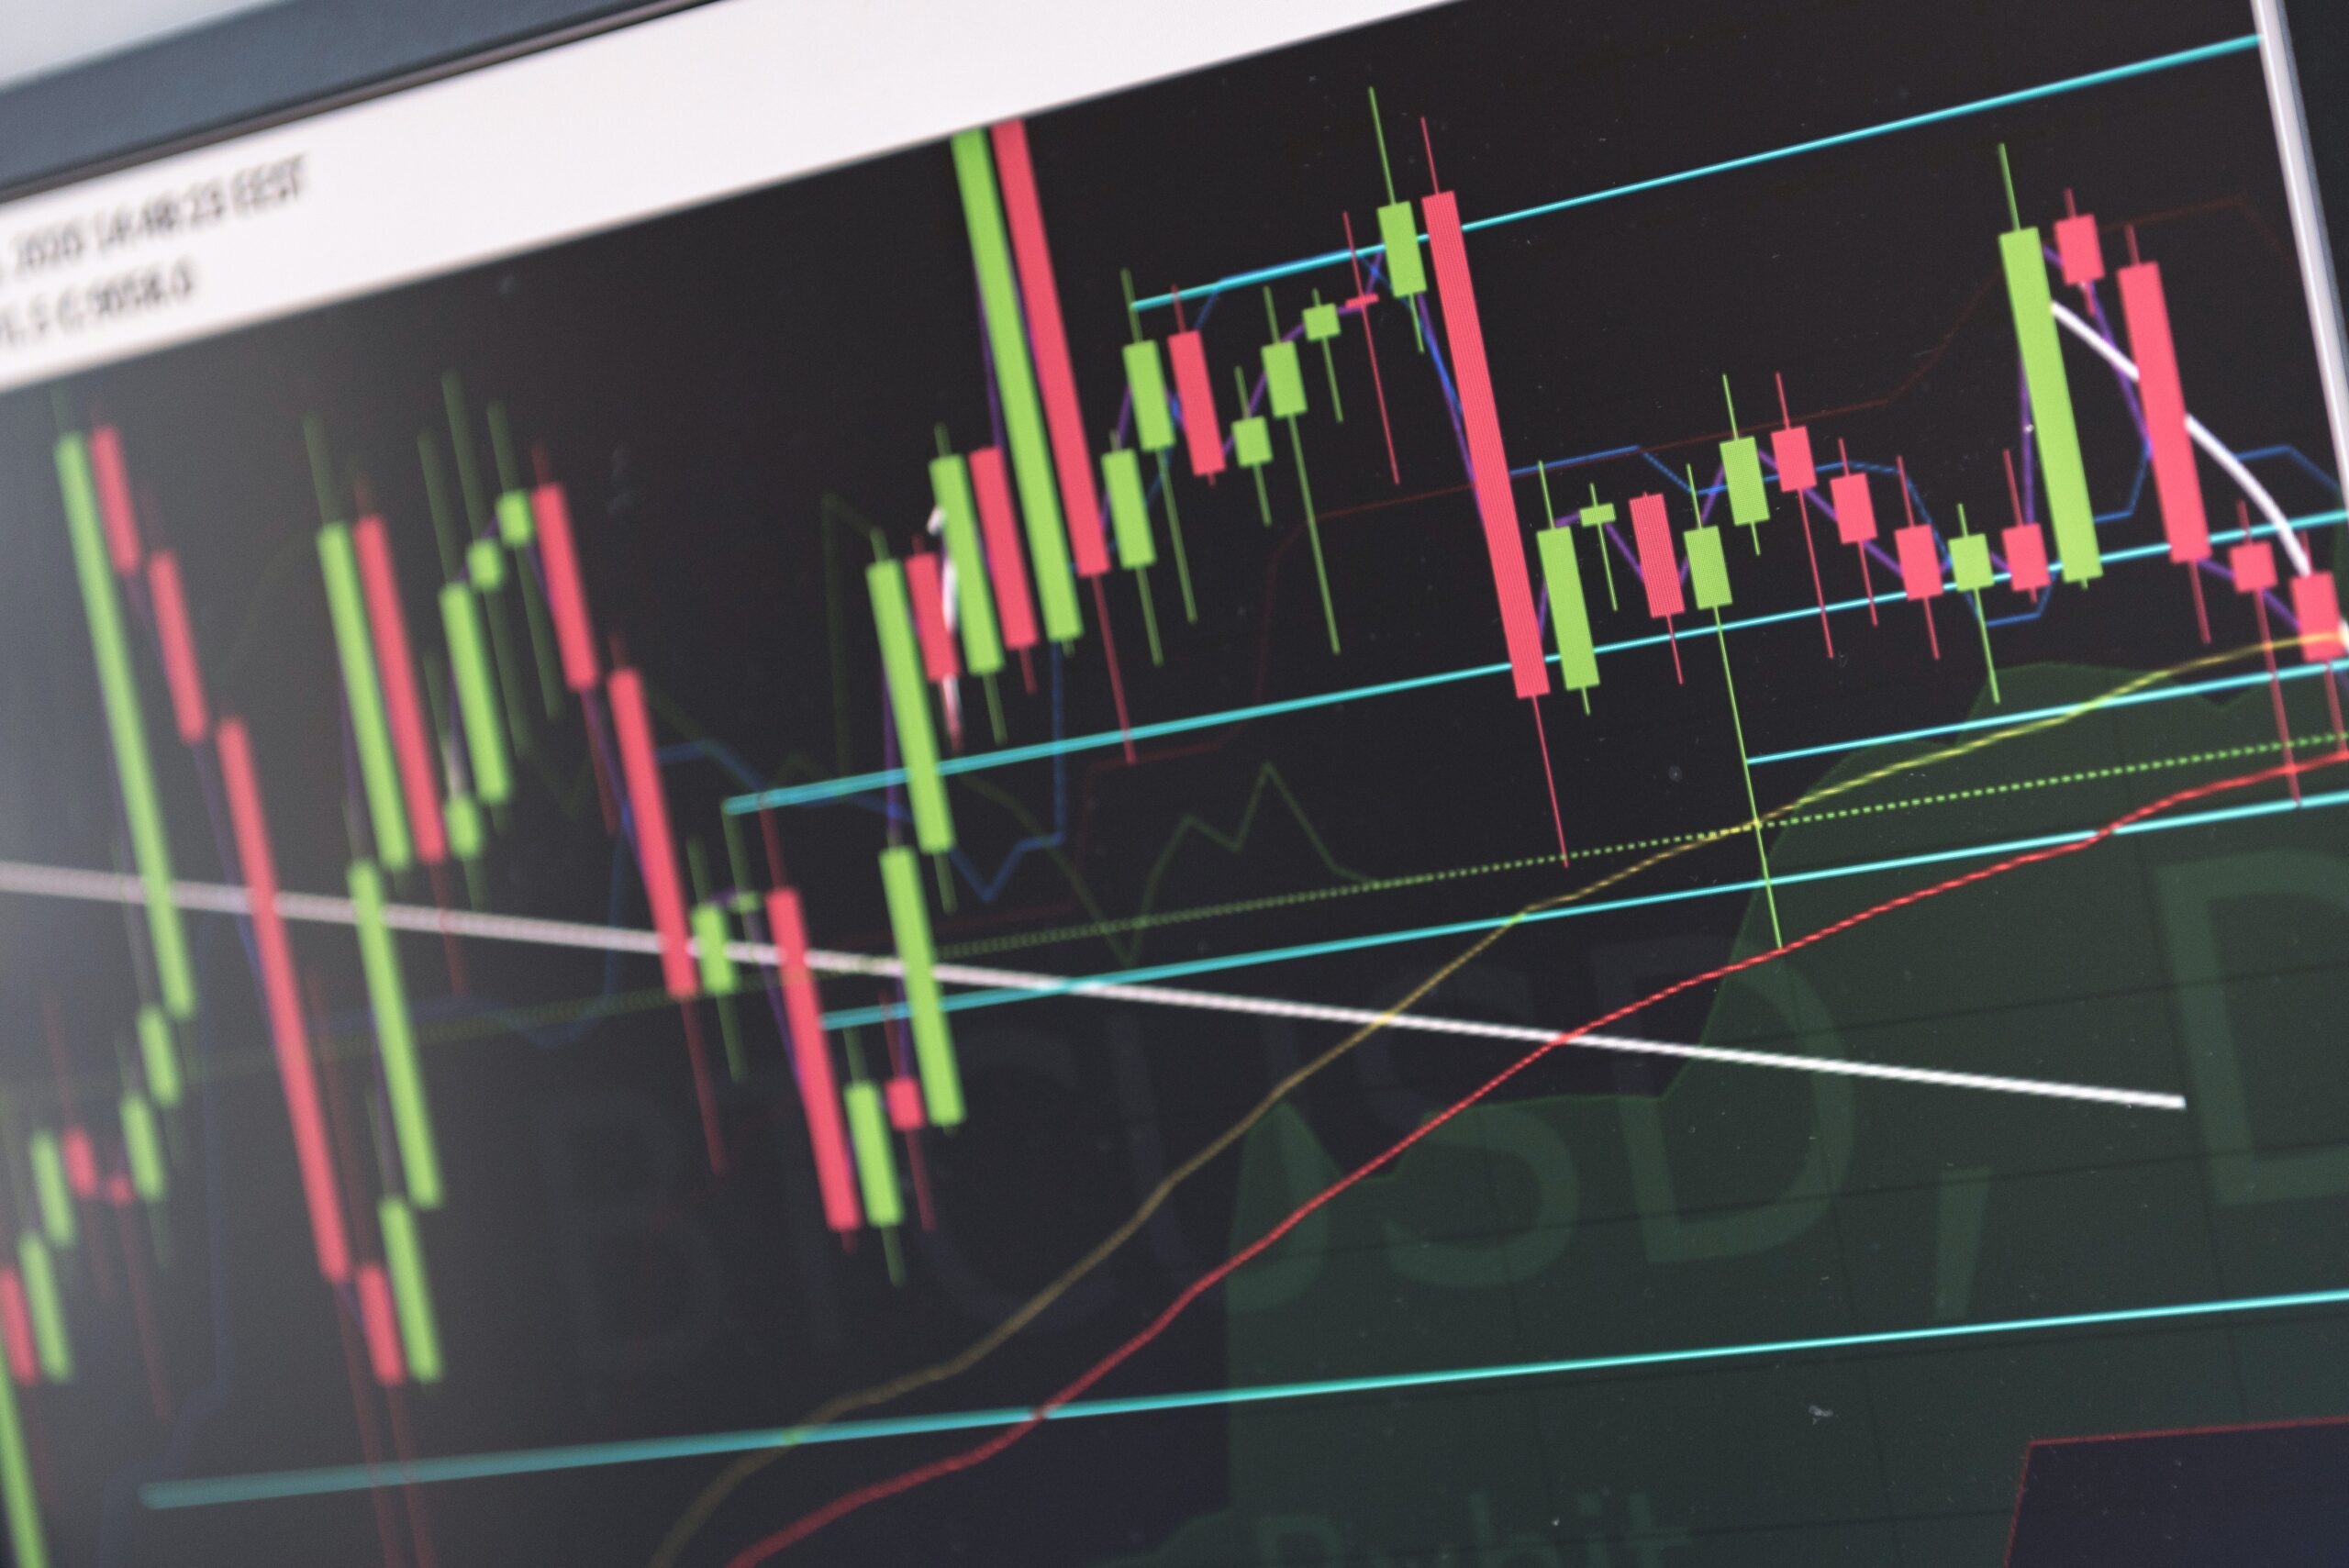
Support and resistance are two of the most important concepts in technical analysis and trading. They are used to identify key levels on a chart where the price of an asset is likely to either find support (bounce up) or resistance (bounce down). In this blog, we will explain the types of support and resistance that traders commonly use.
Horizontal Support and Resistance
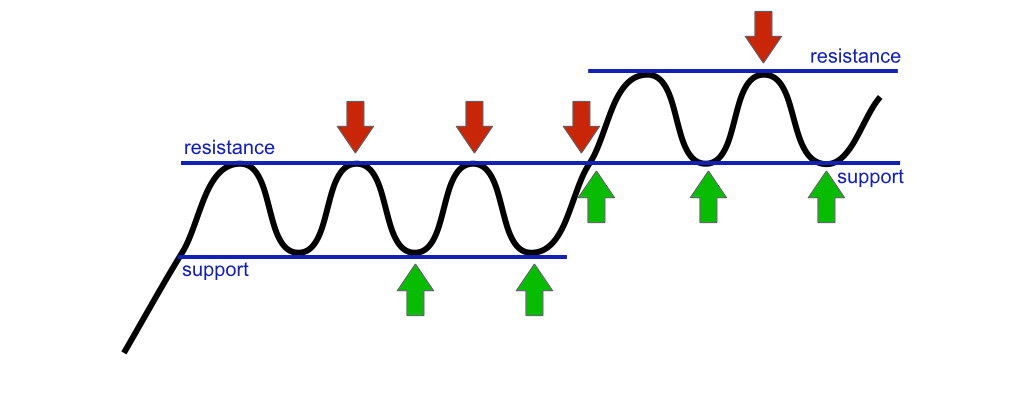
Horizontal support and resistance levels are the most basic and widely used types of support and resistance. They are drawn by connecting two or more price points that are at the same level. These levels act as barriers to price movement and are often identified as key levels by traders.
Horizontal support levels are drawn at the bottom of price movements, where the price has previously bounced up. Conversely, horizontal resistance levels are drawn at the top of price movements, where the price has previously bounced down. These levels are important because they indicate areas where traders can buy (support) or sell (resistance) an asset.
Trendline Support and Resistance
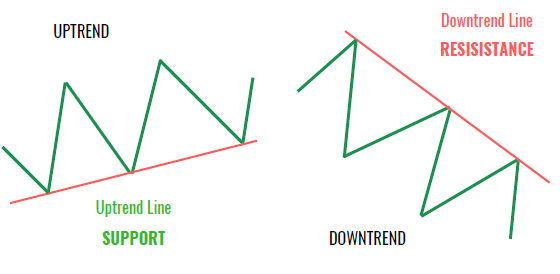
Trendline support and resistance levels are drawn by connecting two or more price points that are trending in the same direction. Trendlines are used to identify the direction of a trend and can help traders identify potential entry and exit points.
A rising trendline connects two or more rising lows and indicates an uptrend. Conversely, a falling trendline connects two or more falling highs and indicates a downtrend. When the price reaches a trendline, it can act as a support or resistance level, depending on the direction of the trend.
Moving Average Support and Resistance
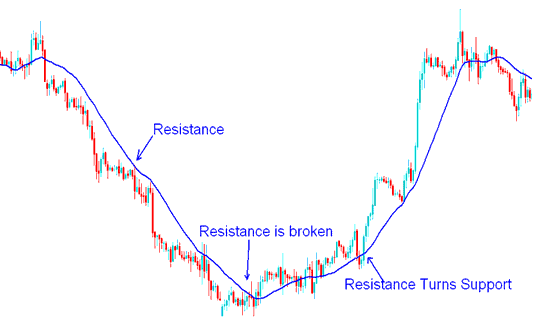
Moving averages are commonly used to identify support and resistance levels. They are calculated by averaging the price of an asset over a certain period of time, such as 50 or 200 days. Moving averages are plotted on a chart and can act as support or resistance levels.
When the price of an asset is above the moving average, it can act as a support level. Conversely, when the price is below the moving average, it can act as a resistance level. Moving averages are commonly used by traders to identify trends and potential entry and exit points.
Fibonacci Retracement Levels
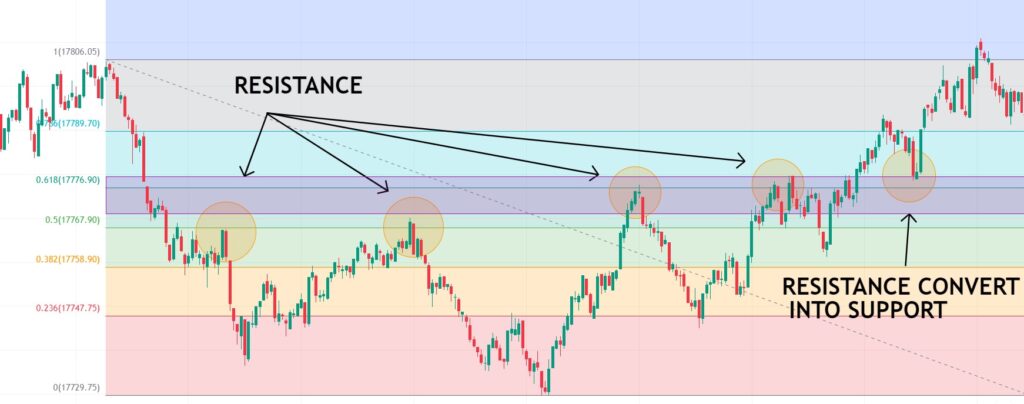
Fibonacci retracement levels are used to identify potential support and resistance levels based on the Fibonacci sequence. The Fibonacci sequence is a series of numbers where each number is the sum of the two preceding numbers. The sequence is 0, 1, 1, 2, 3, 5, 8, 13, 21, 34, 55, 89, 144, and so on.
Fibonacci retracement levels are drawn by connecting two price points and then dividing the vertical distance by the key Fibonacci ratios of 23.6%, 38.2%, 50%, 61.8%, and 100%. These levels are then used as potential support or resistance levels.
In conclusion, there are different types of support and resistance levels that traders use to identify potential entry and exit points. Horizontal support and resistance, trendline support and resistance, moving average support and resistance, and Fibonacci retracement levels are some of the most common types of support and resistance used by traders. By understanding these concepts, traders can make more informed trading decisions and increase their chances of success.


