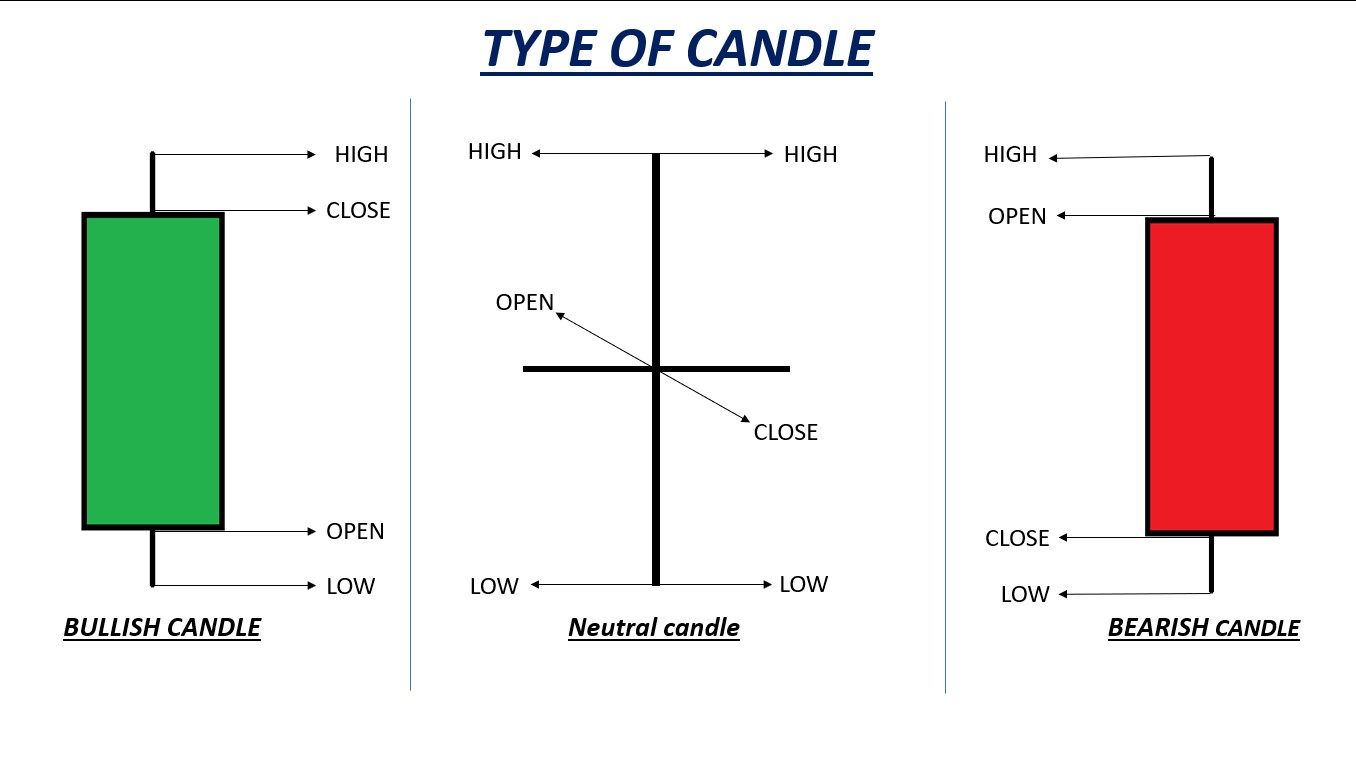
Candlestick charts are an essential tool for technical analysis in the financial market. They are used to track the price movements of various financial instruments such as stocks, currencies, and commodities. Candlestick patterns are formed by the opening, high, low, and closing prices of an asset, and they provide valuable insights into the psychology of the market participants.
When analyzing candlestick patterns, it is important to consider the location of the pattern within the broader market context. One of the most critical levels to consider is the support level, where prices have previously found buying interest and bounced higher. In this blog, we will discuss the top five most powerful candlestick patterns that traders should watch for at support levels.
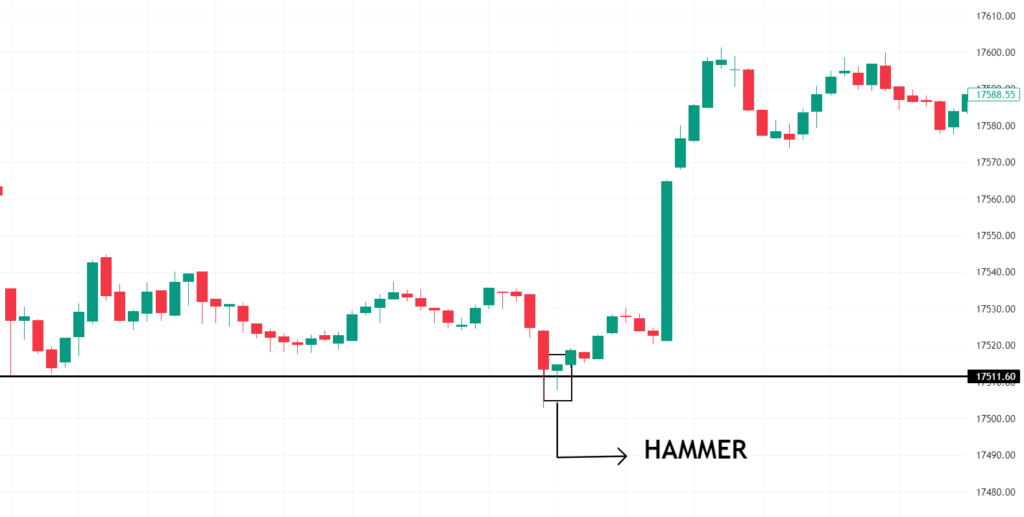
- Bullish Hammer
The bullish hammer is a bullish reversal candlestick pattern that occurs at the bottom of a downtrend. The pattern has a small body, a long lower shadow, and little to no upper shadow. This pattern suggests that buyers have entered the market and have pushed prices higher from the low of the day, indicating a potential reversal of the downtrend.
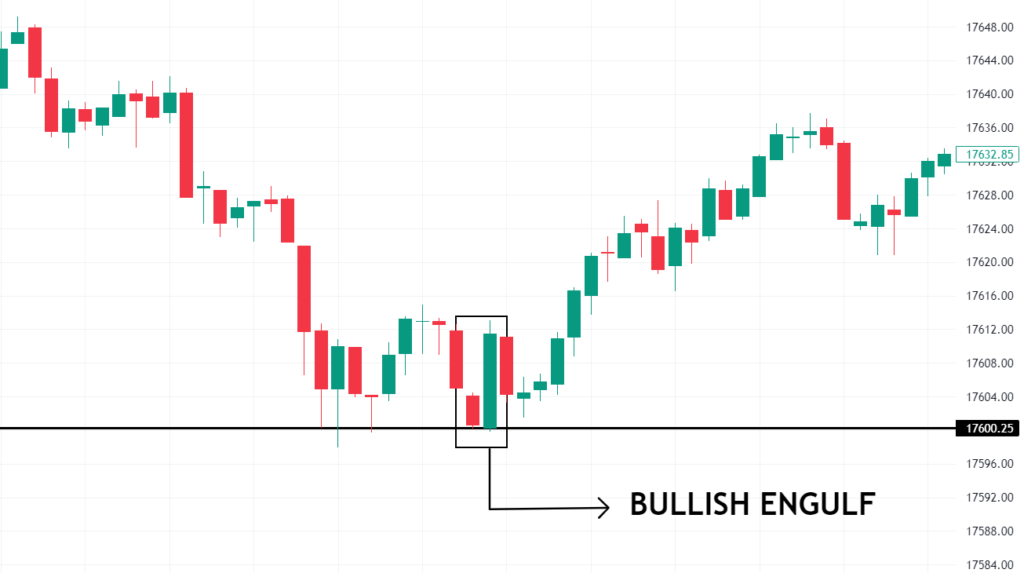
- Bullish Engulfing
The bullish engulfing pattern is a bullish reversal pattern that occurs at the end of a downtrend. It consists of a small bearish candle followed by a larger bullish candle that completely engulfs the previous candle’s body. This pattern suggests that buyers have taken control of the market and have overwhelmed the sellers, indicating a potential reversal of the downtrend.
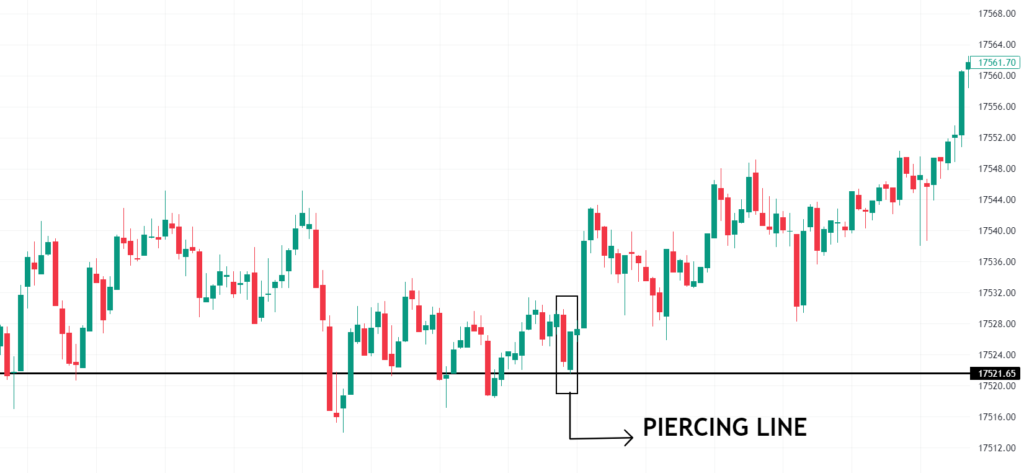
- Piercing Line
The piercing line pattern is a bullish reversal pattern that occurs at the end of a downtrend. It consists of a long bearish candle followed by a bullish candle that opens below the previous candle’s low but closes above the midpoint of the previous candle’s body. This pattern suggests that buyers have entered the market and have pushed prices higher, indicating a potential reversal of the downtrend.
- Bullish Harami
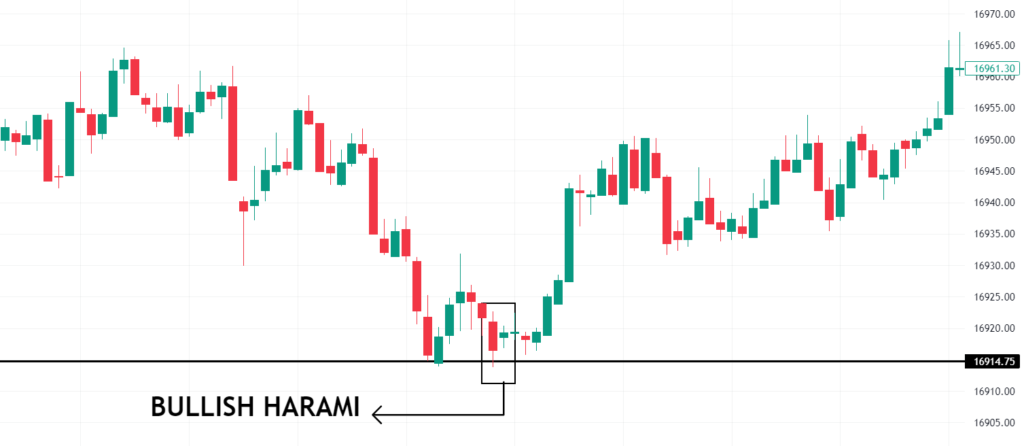
The bullish harami pattern is a bullish reversal pattern that occurs at the end of a downtrend. It consists of a long bearish candle followed by a smaller bullish candle that is completely contained within the body of the previous candle. This pattern suggests that buyers have entered the market, and there is a potential reversal of the downtrend.
- Morning Star
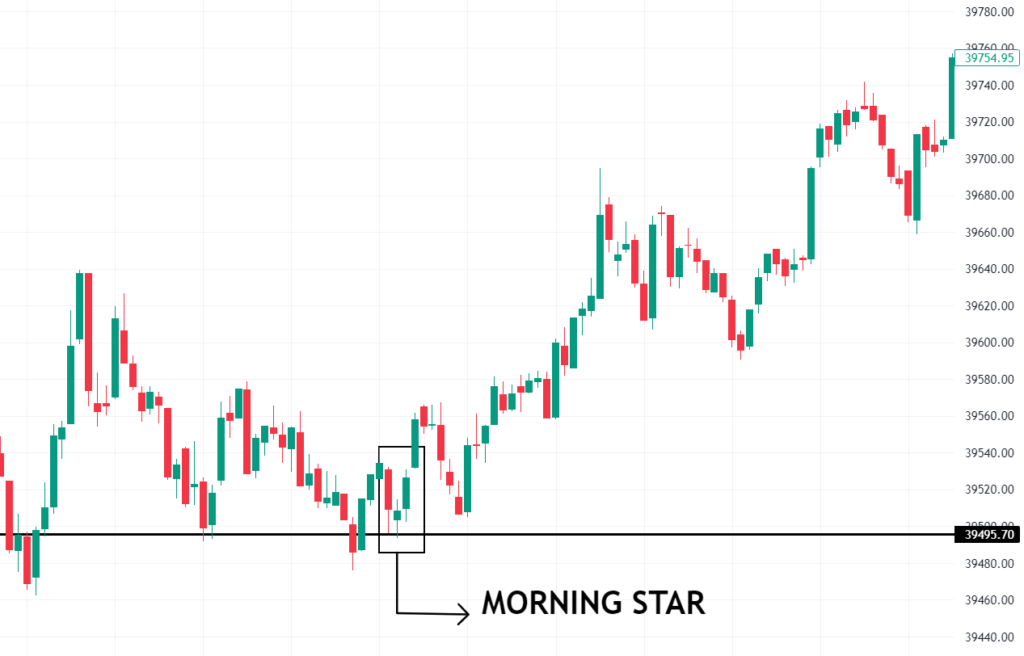
The morning star pattern is a bullish reversal pattern that occurs at the end of a downtrend. It consists of three candles: a long bearish candle, a small-bodied candle with a gap down, and a long bullish candle that opens above the previous candle’s high. This pattern suggests that buyers have entered the market, and there is a potential reversal of the downtrend.
Conclusion
In conclusion, candlestick patterns are powerful tools for technical analysis, and they can provide valuable insights into the psychology of the market participants. When analyzing candlestick patterns, it is important to consider the location of the pattern within the broader market context, especially at support levels. The top five most powerful candlestick patterns to watch for at support levels are the bullish hammer, bullish engulfing, piercing line, bullish harami, and morning star. By understanding and using these patterns effectively, traders can improve their decision-making process and increase their chances of success in the financial markets.


