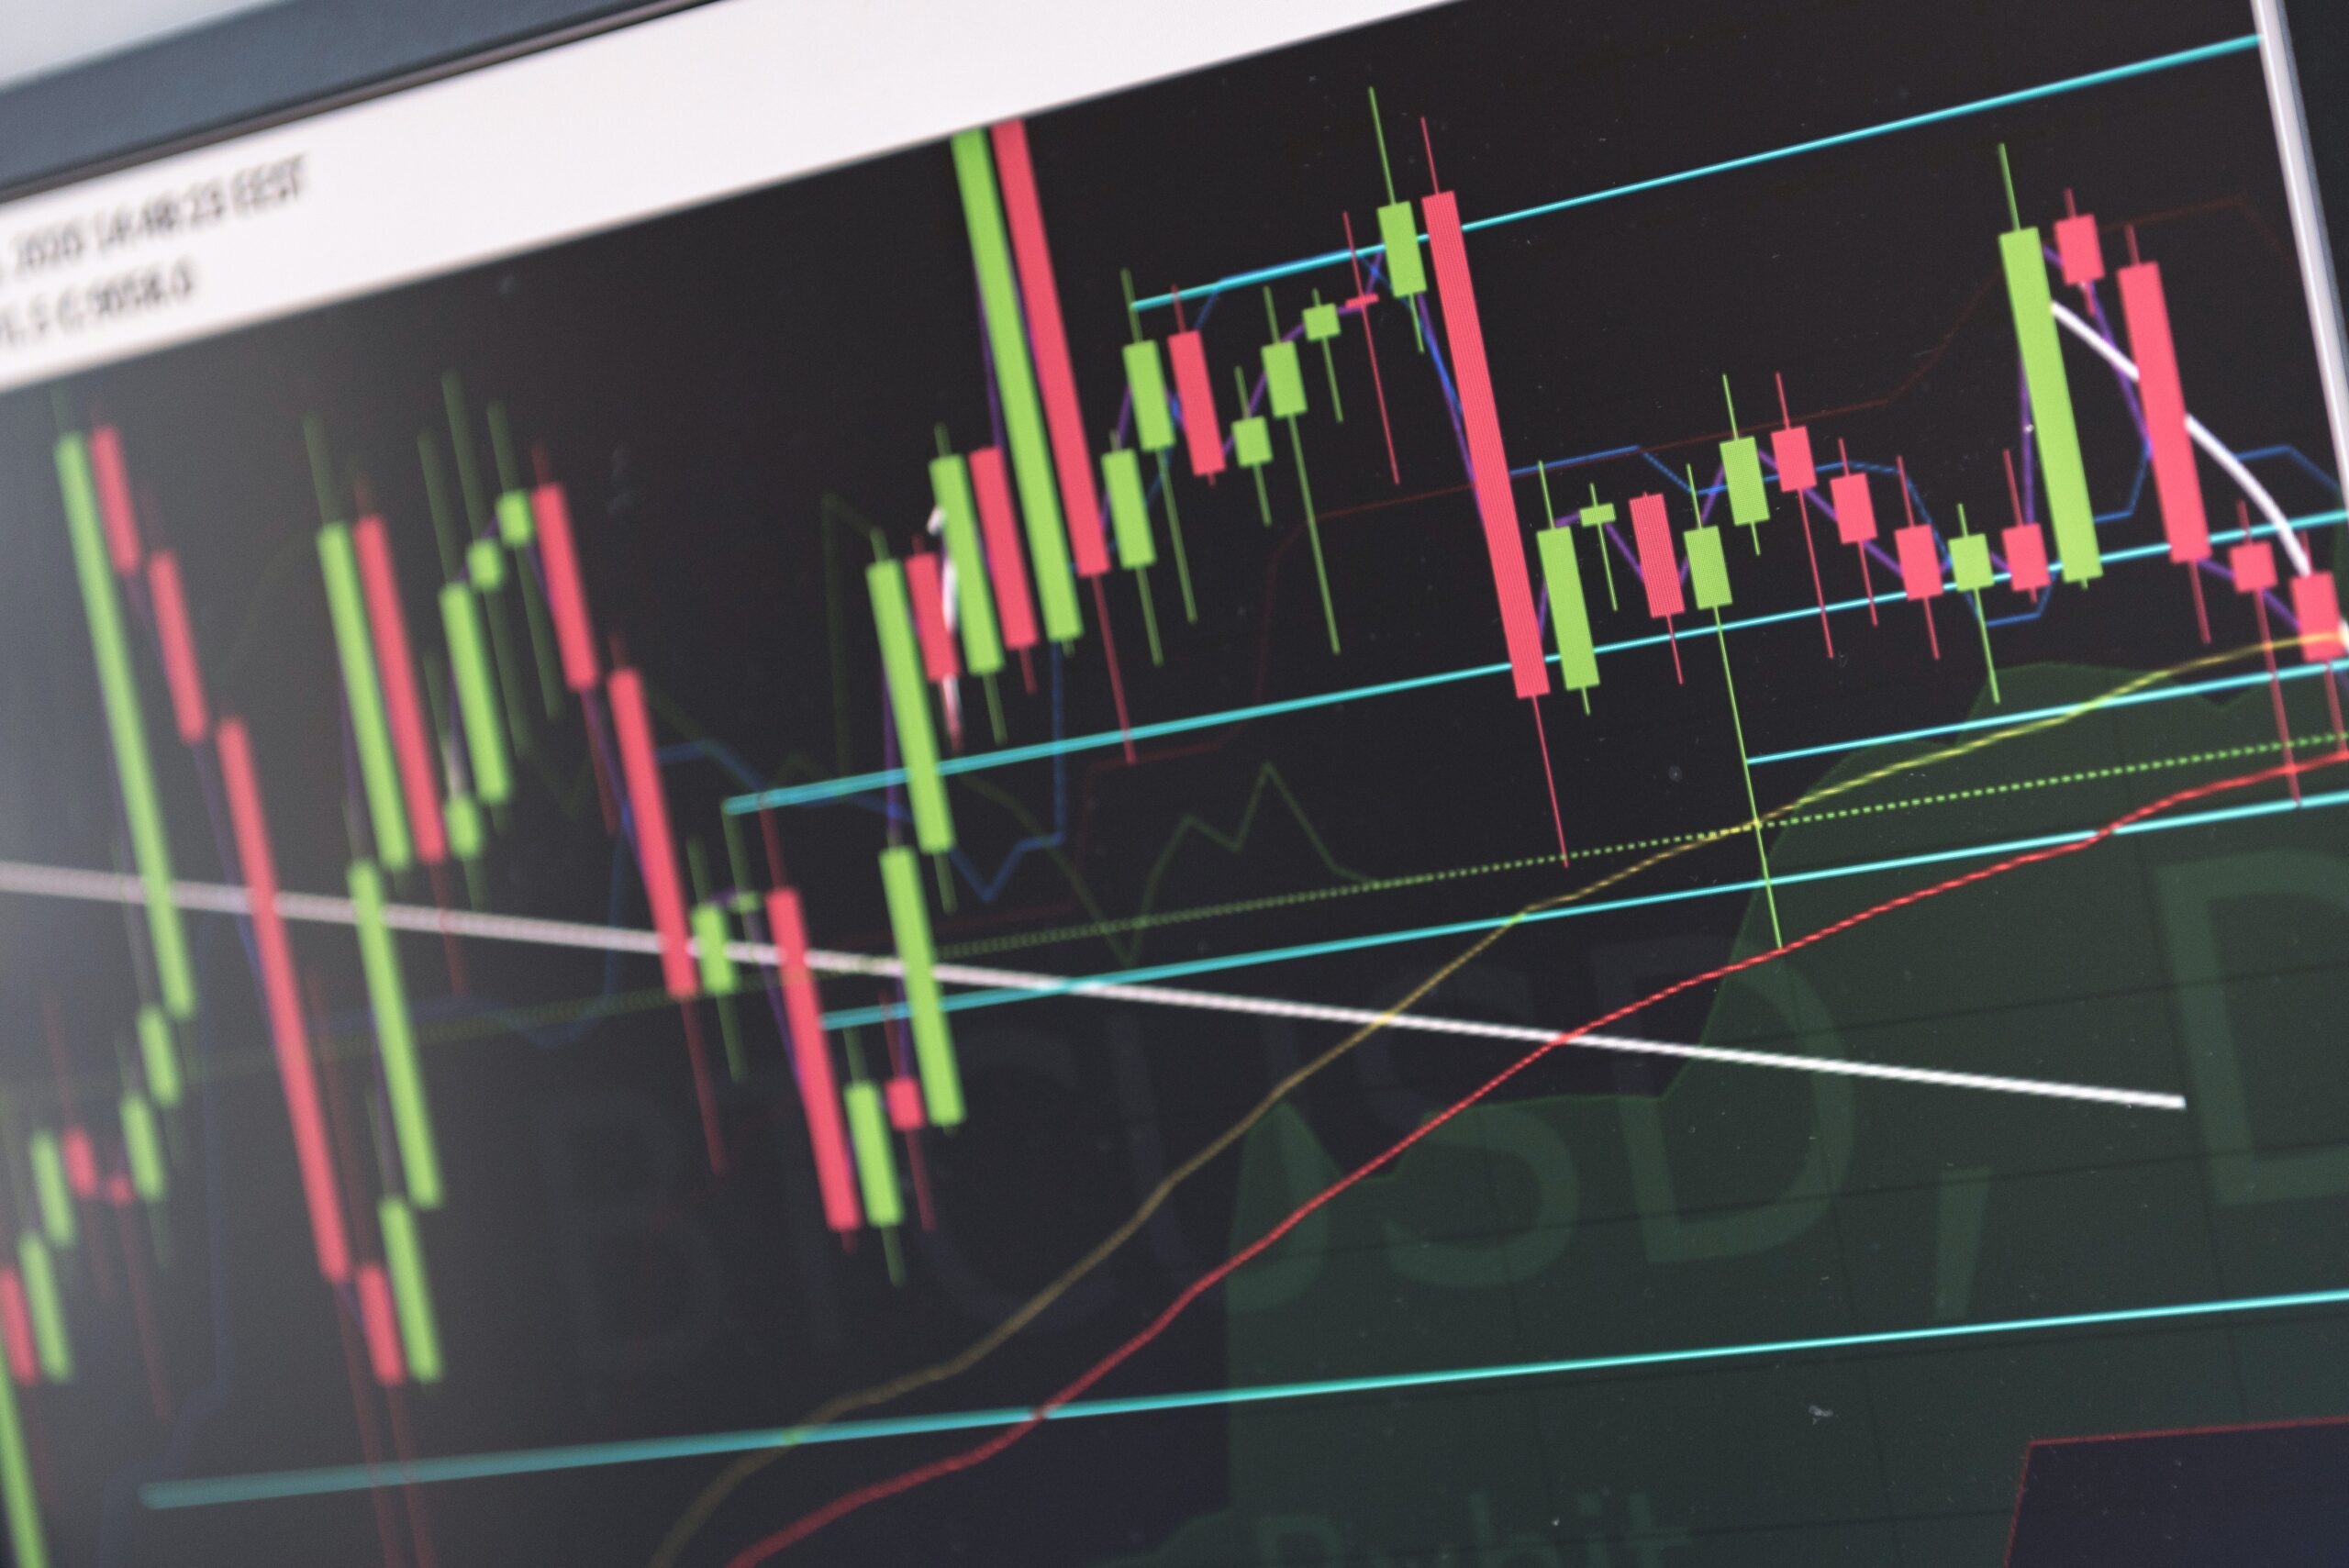
Predicting the movement of the price in the chart can be a challenging task. However, there are several indicators that can help traders make informed decisions about when to buy or sell an asset. In this blog post, we will explore the top 10 indicators that are commonly used by traders to predict price movements.
TOP 10 INDICATORS
Price movement is a crucial aspect of trading and investing in financial markets. Traders and investors use various technical indicators to analyze price movements on charts and make informed trading decisions. In this blog post, we will discuss the top 10 indicators that can help traders and investors to find the price movement on the chart.
- Moving Average (MA): Moving Average is a widely used technical indicator that shows the average price of an asset over a specific period. It helps traders to identify the trend direction of an asset. A rising moving average indicates an uptrend, while a falling moving average indicates a downtrend.
- Relative Strength Index (RSI): RSI is a momentum oscillator that measures the speed and change of price movements. It oscillates between 0 and 100, and a reading above 70 indicates an overbought condition, while a reading below 30 indicates an oversold condition.
- Bollinger Bands (BB): Bollinger Bands is a volatility indicator that consists of three lines – a moving average and two standard deviation lines. It helps traders to identify the volatility of an asset and the potential price movements.
- Moving Average Convergence Divergence (MACD): MACD is a trend-following momentum indicator that shows the relationship between two moving averages. It consists of a MACD line and a signal line. When the MACD line crosses above the signal line, it indicates a bullish trend, while a bearish trend is indicated when the MACD line crosses below the signal line.
- Fibonacci Retracement: Fibonacci Retracement is a technical analysis tool that uses horizontal lines to indicate areas of support or resistance at the key Fibonacci levels. It helps traders to identify potential price reversal points.
- Ichimoku Cloud: Ichimoku Cloud is a trend-following indicator that provides a comprehensive view of potential support and resistance levels, trend direction, momentum, and trading signals. It consists of five lines that work together to provide a complete picture of the market trend.
- Average Directional Index (ADX): ADX is a trend strength indicator that measures the strength of a trend. A high ADX value indicates a strong trend, while a low ADX value indicates a weak trend.
- On-Balance Volume (OBV): OBV is a volume indicator that measures buying and selling pressure. It adds the volume on up days and subtracts the volume on down days. A rising OBV indicates buying pressure, while a falling OBV indicates selling pressure.
- Stochastic Oscillator: Stochastic Oscillator is a momentum indicator that shows the location of the current closing price relative to the high-low range over a specific period. It oscillates between 0 and 100, and a reading above 80 indicates an overbought condition, while a reading below 20 indicates an oversold condition.
- Volume: Volume is the total number of shares or contracts traded during a specific period. It helps traders to identify the strength of a trend and potential price movements.
In conclusion, these ten indicators can be used by traders and investors to analyze price movements on charts and make informed trading decisions. However, it is important to note that no single indicator is foolproof, and traders should always use multiple indicators to confirm their trading decisions. Additionally, it is crucial to have a solid understanding of the underlying fundamentals and market conditions to make informed trading decisions.


